
Dynamic surface and interfacial tension describe the evolution of the free energy of a fluid interface after it has been created, expanded or otherwise displaced from adsorption equilibrium. In a pure liquid, the surface tension is often treated as a time-independent thermodynamic property at fixed temperature and pressure. In a multicomponent liquid containing surfactants, proteins, polymers or other surface-active species, this simplification is generally invalid for a newly formed interface. Adsorption requires finite time. Molecules must be transported through the adjoining bulk phase or phases, enter the interfacial region and, in many systems, reorganize after adsorption. Consequently, both the adsorbed amount Γ(t) and the surface or interfacial tension γ(t) become functions of time. [P1, P2, 1, 19]
The scientific importance of dynamic tension arises from the fact that many technological interfaces exist only briefly. Bubbles in foaming processes, droplets in sprays and inkjet printing, freshly generated oil-water interfaces during emulsification, and rapidly coated films are created on timescales ranging from microseconds to seconds. The equilibrium surface tension measured after minutes or hours may therefore be physically irrelevant to the actual process. A surfactant can exhibit a strong equilibrium reduction in surface tension yet adsorbs too slowly to influence a rapidly expanding interface. Conversely, a species with a modest equilibrium effect may dominate the earliest stages if its transport is sufficiently fast. [P1, P2, 19]
Dynamic tension cannot be understood from a single kinetic equation. The experimentally observed function γ(t) is the result of at least two coupled relationships. A transport or kinetic model determines the evolution of surface excess Γ(t), while an interfacial equation of state relates Γ to γ. The classical Ward-Tordai theory describes diffusion-controlled adsorption to a newly created planar interface and remains a foundational reference for short-time adsorption. More elaborated treatments include electrostatic barriers, finite-rate adsorption/desorption, micellar relaxation, convective transport, changing interfacial area and finite-volume depletion. Growing-drop experiments additionally require explicit coupling between adsorption and the rate of interfacial expansion. [P1, P2, 1, 19, 2]
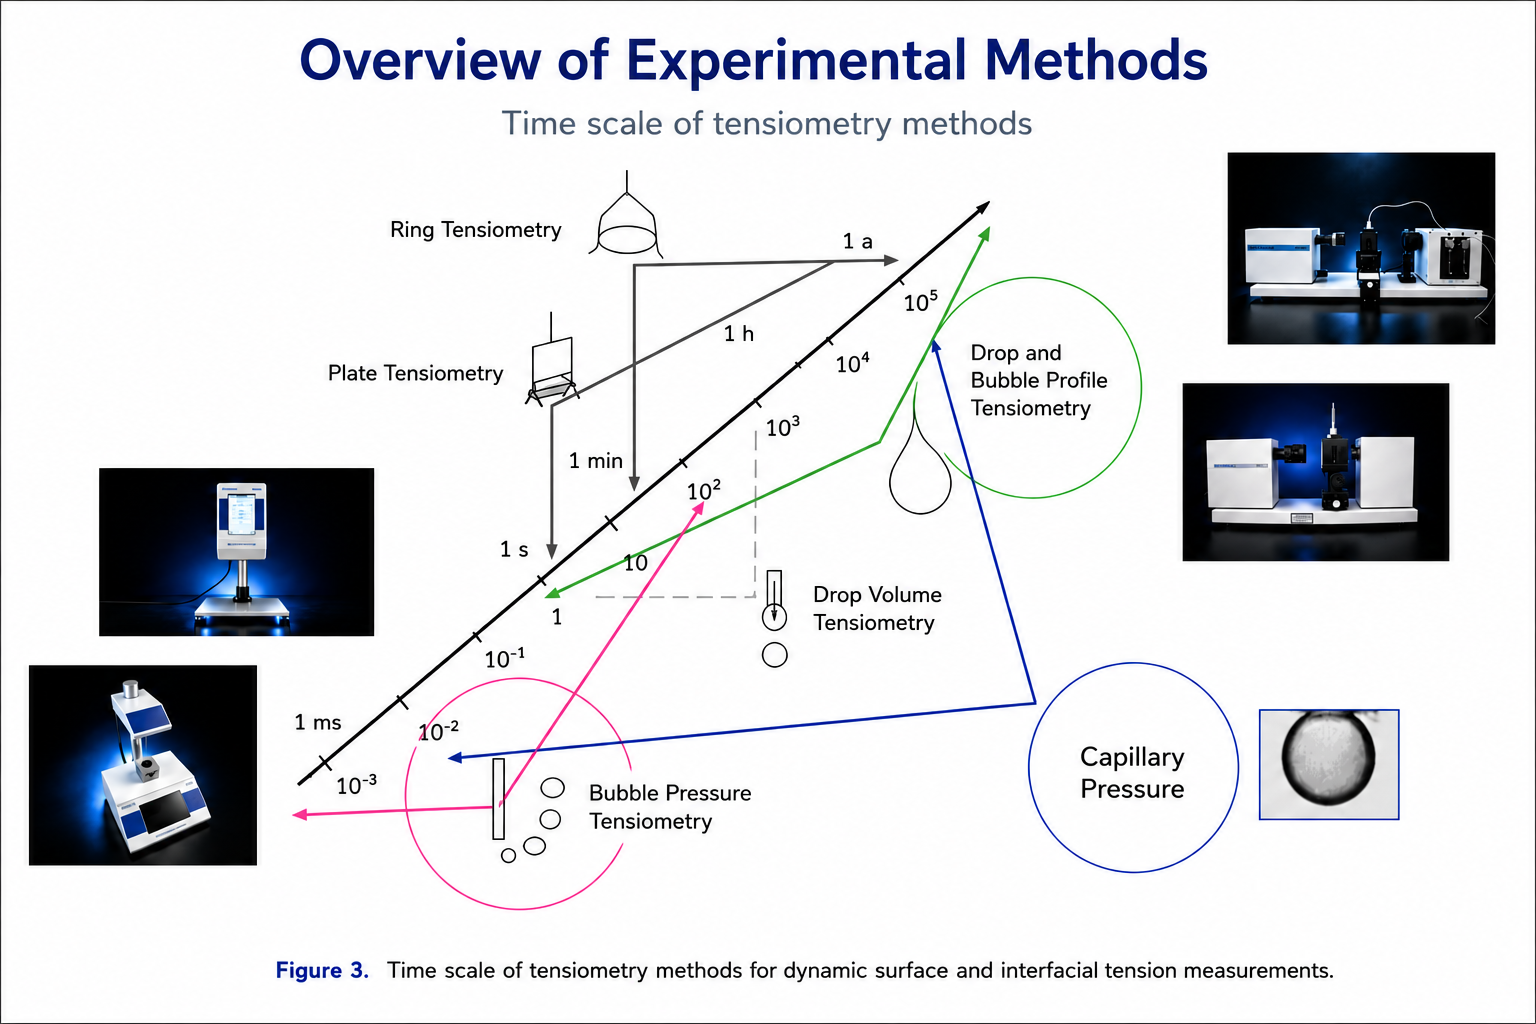
Experimentally, no single tensiometric method spans the complete relevant time domain. The lecture material used as the primary basis of this review emphasizes the complementarity of methods. Maximum bubble pressure tensiometry provides access to millisecond and sub-millisecond adsorption, whereas drop and bubble profile analysis covers approximately seconds to hours and is highly versatile for liquid-gas and liquid-liquid interfaces. Drop-volume methods occupy an intermediate range, while capillary-pressure approaches provide unique access to liquid-liquid systems with small density differences and to rapid interfacial processes. Force methods remain useful for slower measurements but are restricted in their ability to resolve rapid adsorption. [P2, P3, 7, 11, 18]
The interpretation of dynamic measurements is inseparable from instrument physics. In maximum bubble pressure tensiometry, the total bubble period is not identical to the surface lifetime. Bubble lifetime, deadtime and bubble time must be distinguished, and the measured pressure contains capillary, hydrostatic and hydrodynamic contributions. The viscosity of the liquid can strongly affect deadtime, and an incorrect age assignment can produce errors of several mN/m in the apparent dynamic surface tension. Likewise, profile-analysis measurements can be affected by finite-drop depletion, initial adsorption during drop formation and traces of surface-active impurities. [P2, P3, 7, 11, 18]
This review develops a unified framework connecting adsorption kinetics, interfacial age and the major experimental techniques used to measure dynamic surface and interfacial tension. Particular emphasis is placed on the methodological framework developed in the work of Miller, Liggieri, Fainerman, Makievski and collaborators, because it links the theory of adsorption to experimentally measurable time windows and explicitly analyzes the limitations of each technique. The central conclusion is that dynamic tension is not a single material constant but the property of a defined interface at a defined age under a defined formation history. [P1, P2, 19]
dynamic surface tension; dynamic interfacial tension; adsorption kinetics; surface age; interface lifetime; Ward-Tordai equation; diffusion-controlled adsorption; maximum bubble pressure tensiometry; bubble pressure; deadtime; bubble time; profile analysis tensiometry; pendant drop; drop volume tensiometry; capillary pressure; growing drop; depletion; initial load; surfactants [P1, P2, 2, 19, 7]
Introduction
Surface and interfacial tension are thermodynamic measures of the reversible work required to create interfacial area. For an equilibrium interface at fixed temperature, pressure and composition, the tension can be treated as a state property. The situation changes fundamentally when the interface contains adsorbing species and has been created recently. The interfacial composition is then not yet in equilibrium with the bulk phase. As adsorption proceeds, the free energy per unit area changes, and the measured tension becomes time dependent. [P1, P2, 1, 19]
The distinction between equilibrium and dynamic tension is essential in colloid and interface science. Equilibrium measurements answer a thermodynamic question: what interfacial state is reached after all relevant transport and relaxation processes have completed? Dynamic measurements answer a kinetic question: what interfacial state exists after a specified time following interface formation? These are not alternative ways of measuring the same quantity. They are different observables associated with different physical states. [P1, 1, 19]
This distinction is especially important for surfactant solutions. When a clean or weakly populated interface is generated, surfactant molecules are initially located predominantly in the bulk. Molecules then diffuse or are transported by convection toward the interface, cross the subsurface region and adsorb. The adsorption layer progressively lowers the interfacial free energy. At a fixed bulk concentration, the surface excess Γ therefore increases with time while γ usually decreases toward its equilibrium value. The relation is conceptually simple, but the mechanisms controlling the rate may be complex. [P1, P2, 1, 19]
Dynamic surface tension is often introduced through the example of surfactant adsorption at a water-air surface, yet the concept extends directly to liquid-liquid interfaces. At an oil-water boundary, adsorption can occur from both sides; surfactant can partition between phases; oil molecules can participate in the interfacial layer formation; and low density differences can make some experimental geometries insensitive. Dynamic interfacial tension is therefore not merely the surface-tension problem with a second liquid replacing air. The mass-transfer problem and the measurement physics can both change. [P1, P2, 19]
The central experimental challenge is time. Interfacial phenomena span many orders of magnitude. Bubble pressure methods can probe adsorption in the sub-millisecond and millisecond regime. Drop-volume or drop-pressure approaches occupy intermediate ranges. Profile analysis is particularly strong as it covers a time range from seconds to hours and allows a single interface to be followed continuously. Force methods such as ring and plate tensiometry are primarily long-time techniques. The resulting picture is one of complementarity rather than methodological competition. [P2, P3, 7, 11, 18]
Thermodynamic basis of time-dependent tension
Interfacial free energy
For a fluid interface of area A, the surface or interfacial tension γ is the reversible Gibbs free-energy change associated with an infinitesimal area increase under appropriate thermodynamic constraints. In the simplest notation, the interfacial work term is γdA. This definition applies whether the interface is liquid-gas or liquid-liquid. The value of γ depends on temperature, pressure and the chemical potentials of the species present at the interface. [P1, 1, 19]
γ = (∂G/∂A)T,p,n
In an adsorption-active system, the interfacial composition is itself a state variable. If the interface is not at equilibrium, its instantaneous tension corresponds to its instantaneous molecular state. The dynamic function γ(t) therefore reports the changing free energy of the adsorption layer as transport and molecular organization proceed. [P1, P2, 19]
Surface excess and Gibbs adsorption
The Gibbs adsorption equation links changes in equilibrium interfacial tension to the surface excesses Γ_i and chemical potentials μ_i of the components. At constant temperature and pressure, the general differential form is dγ = -ΣΓ_i dμ_i. This relation is of thermodynamic nature and does not itself specify how fast adsorption occurs. [P1, P2, 1, 19]
dγ = − Σ Γᵢ dμᵢ
This distinction between thermodynamics and kinetics is fundamental. Gibbs adsorption tells us how interfacial composition and tension are related at equilibrium. A kinetic model tells us how rapidly the system moves through non-equilibrium states. To predict γ(t), both aspects are needed: a time-dependent adsorption model yielding Γ(t) and an equation of state yielding γ as a function of Γ. [P1, P2, 1, 19]
Surface pressure
For surfactant solutions it is often useful to define the surface pressure π relative to a clean solvent interface. If γ_0 is the surface tension of the pure solvent and γ(t) the instantaneous tension of the solution, the dynamic surface pressure is π(t) = γ_0 - γ(t). This quantity increases as the interface becomes progressively populated by surface-active molecules. [P1, P2, 19]
π(t) = γ₀ − γ(t)
A dynamic surface-pressure curve should not be interpreted as a direct adsorption curve unless an appropriate equation of state is known. Two interfacial layers with the same surface excess can produce different tensions if their molecular organization differs. This is particularly relevant for proteins, mixed surfactants and layers that undergo reorientation or lateral aggregation. [P1, P2, 1, 19]
What makes an interface dynamic?
Transport from the bulk
The first requirement for adsorption is transport. A molecule located far from a newly created interface must reach the interfacial region. In a quiescent solution, molecular diffusion often provides the dominant transport mechanism. A concentration gradient develops because molecules are removed from the subsurface as they adsorb. The gradient drives further diffusive flux toward the interface. [P1, P2, 2, 19]
The characteristic diffusion time depends on the square of the transport distance divided by the diffusion coefficient. Small surfactants can therefore respond on much shorter timescales than larger molecules like proteins or polymers. High bulk concentration also increases the molecular flux available to populate a new interface. These simple trends explain why dynamic surface-tension curves usually approach equilibrium faster as surfactant concentration increases. [P1, P2, 2, 19]
Convective transport
Many tensiometric and industrial processes are not perfectly quiescent. Formation of a bubble or drop displaces liquid and can create convection near the interface. Rapid gas flow in bubble pressure tensiometry, liquid inflow during drop growth, or bulk recirculation around a rising bubble may alter the transport field. The observed adsorption kinetics can therefore deviate from purely diffusive predictions even when no explicit mixing is imposed. [P2, P3, 7, 11, 18]
Convection is not automatically an artefact. In a process-simulation experiment it may be physically relevant. The key requirement is to know whether the measurement is intended to isolate intrinsic diffusion-controlled adsorption or reproduce a practical interfacial history. The interpretation must match the experimental objective. [P1, P2, 2, 19, 17]
Interfacial kinetic barriers
Arrival of a surfactant molecules at the subsurface does not guarantee immediate adsorption. Molecules can face an energetic barrier associated with dehydration, electrostatic repulsion, steric constraints or the need to reorient before incorporation into a dense adsorption layer. If this interfacial step is slow relative to diffusion, the adsorption becomes kinetically controlled or mixed controlled. [P1, P2, 2, 19]
For ionic surfactants, electrostatic effects are particularly important. When charged molecules adsorb, an interfacial electric potential develops and can oppose further adsorption of like-charged species. Added electrolyte screens this repulsion and can accelerate adsorption dramatically. A system that appears kinetically limited at low ionic strength may approach diffusion control after salt is added. [P1, P2, 2, 19]
Rearrangement after adsorption
The tension can continue to change even after the required number of molecules have reached the interface. Adsorbed molecules may reorient, unfold, aggregate or displace other components. For low-molecular-weight surfactants these structural relaxations may be rapid, but for proteins and polymers they can dominate long-time dynamics. In mixed systems, one component can adsorb quickly and later be replaced by another with higher equilibrium affinity. [P1, P2, 19]
Dynamic tension is consequently a convolution of transport and interfacial organization. A monotonic decrease in γ does not uniquely reveal which microscopic mechanism is rate limiting. Mechanistic conclusions require concentration series, complementary time windows and, where possible, structural or rheological measurements. [P4, 5, 14, 15]
Diffusion-controlled adsorption and the Ward-Tordai framework
The classical diffusion problem
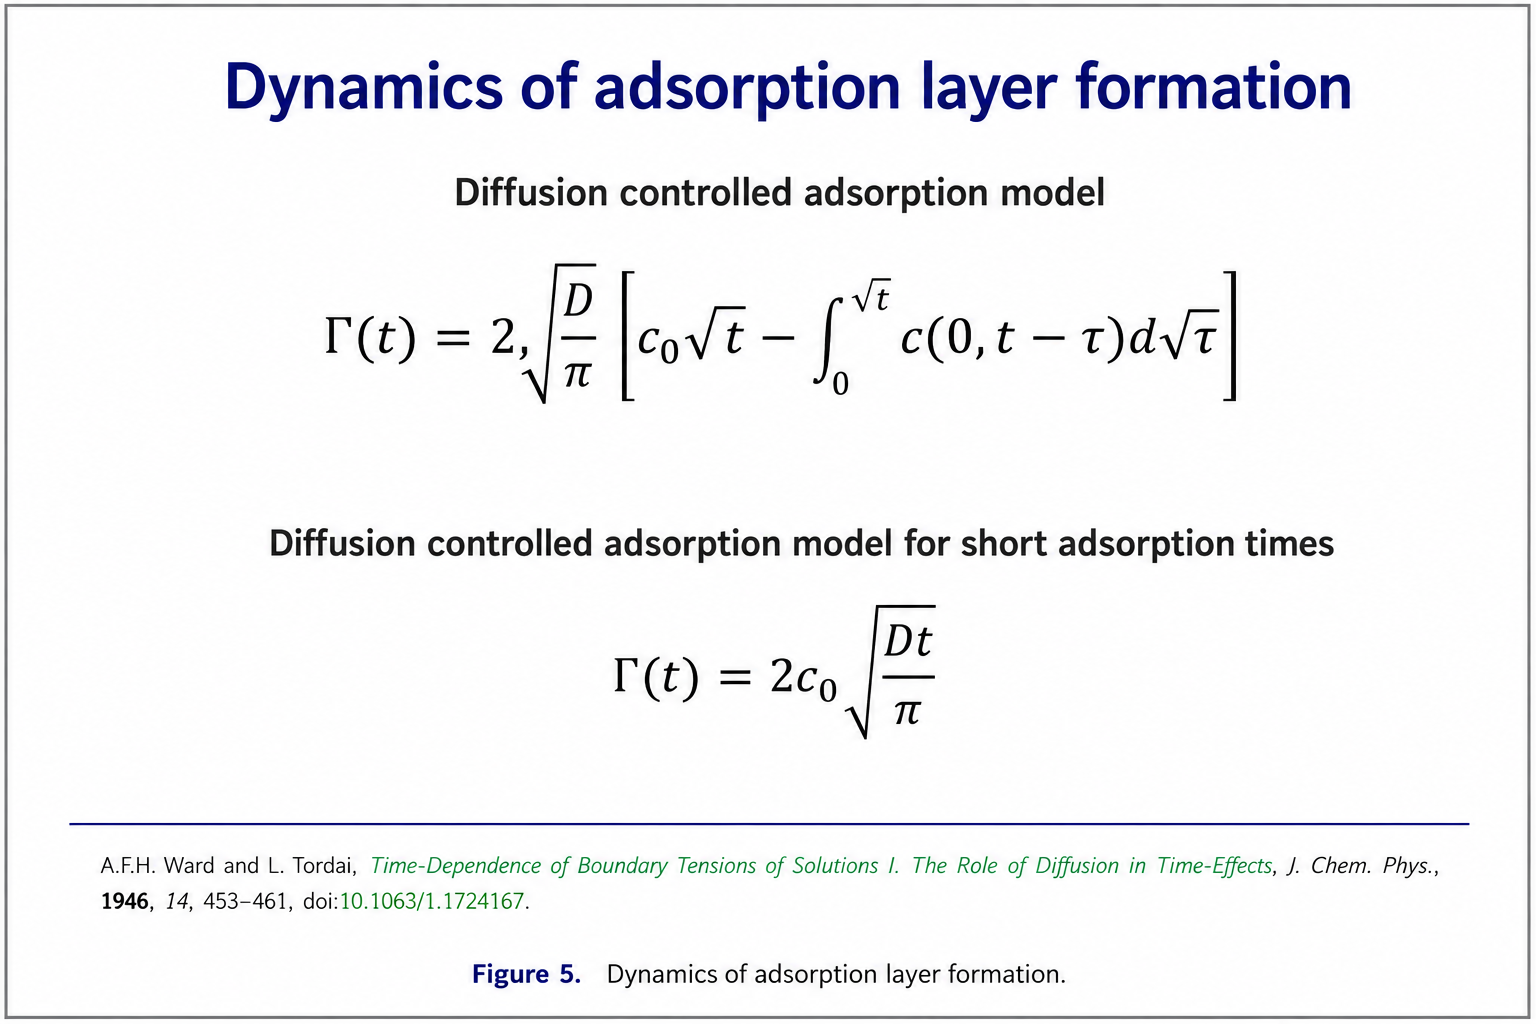
Ward and Tordai formulated the classical theory of diffusion-controlled adsorption to a newly created interface. The model considers the depletion of solute near the interface as molecules adsorb and includes the possibility of back-diffusion from the subsurface region. The result is an integral relation between surface excess and the time-dependent subsurface concentration. [P1, P2, 1, 19, 2]
Γ(t) = 2c₀√(Dt/π) − 2√(D/π) ∫₀ᵗ c_s(τ)/√(t−τ) dτ
c₀ is the bulk concentration, D the diffusion coefficient and c_s the time-dependent subsurface concentration. [P1, 2, 19]
The first term represents the maximum diffusive delivery that would occur if molecules arriving at the interface were irreversibly removed without changing the subsurface boundary condition. The integral term accounts for the evolving concentration near the interface and the possibility of molecules returning to the bulk. The equation is general at the transport level; closure requires an adsorption isotherm or kinetic boundary condition that relates the subsurface concentration to the surface excess. [P1, P2, 1, 19]
Short-time limit
At very short times, when the interface is far from saturation and the subsurface concentration has not changed strongly, the back-diffusion term is small. The surface excess then grows approximately with the square root of time. [P1, 1, 19, 2]
Γ(t) ≈ 2c₀√(Dt/π)
This √t dependence is frequently used as a diagnostic for diffusion-controlled adsorption. It should, however, be applied cautiously. Experimental time resolution, uncertain surface age and interface formation itself can obscure the earliest regime. A square-root trend over a narrow interval is suggestive but not sufficient to prove that all later adsorption is diffusion controlled. [P1, P2, 2, 19]
From Γ(t) to γ(t)
The Ward-Tordai equation predicts surface excess rather than tension. A thermodynamic equation of state is required to convert Γ(t) into γ(t). For a dilute ideal adsorption layer the relation may be simple; for realistic surfactant layers a Langmuir, Frumkin, reorientation or aggregation model may be needed. The combined model thus has two layers: transport and interfacial thermodynamics. [P1, P2, 1, 19, 2]
This two-step structure explains why two surfactants with similar diffusion coefficients can show very different dynamic surface-tension curves. If one surfactant produces a large surface-pressure change at low coverage while another requires near-saturation before γ changes strongly, the same Γ(t) behavior can map to very different γ(t) trajectories. [P1, P2, 2, 19]
Long-time behavior
At longer times, the interface approaches equilibrium and the driving concentration gradient decreases. The kinetics become increasingly sensitive to desorption, back-diffusion, interfacial interactions and any slow structural relaxation within the layer. Fitting a complete γ(t) curve with a short-time asymptotic relation is therefore not justified. A physically meaningful analysis should use the full kinetic model over the range in which its assumptions are valid. [P1, 2, 19]
Growing interfaces and dynamic area
Many interfaces are generated while their area is changing. A pendant drop can be dosed continuously, a bubble expands before detachment, and industrial droplets grow or stretch during atomization. In these cases, adsorption and area changes occur simultaneously. The surface excess, defined as adsorbed amount per unit area, can decrease through dilution even while the total number of adsorbed molecules increases. [P1, P2, 1, 19, 4]
MacLeod and Radke introduced a growing-drop approach in which the instantaneous pressure and drop size are used to determine the dynamic interfacial tension while the drop radius R(t) changes. The lecture material highlights this framework as a particularly important theory for adsorption at growing drops because it includes Γ(t), bulk concentration, the initial interfacial load Γ(0) and the time-dependent radius. [P3, P1, 9, 10, 19]
A(t) = 4πR(t)²
The surface balance for a growing interface contains two competing effects: molecular flux to the interface increases the total adsorbed amount, while area growth dilutes the surface concentration. A fast-growing interface can therefore retain a high tension even when adsorption from the bulk is rapid, because newly created area continuously outruns molecular supply. [P1, P2, 19]
This effect is central to interpreting process-relevant dynamic tension. A static pendant-drop measurement and a rapidly expanding interface can have the same chronological age yet different surface coverages because their area histories differ. The relevant descriptor is not only time since th moment of creation but the complete interfacial deformation history. [P2, P3, 4, 12, 13]
Interfacial age, initial load and the definition of time
Chronological time versus interfacial age
The phrase 'surface age' appears simple but is method dependent. For an interface generated nearly instantaneously and then held at constant area, time since creation is a reasonable approximation. For a bubble that grows continuously, different portions of the interface are created at different times. The measured signal may correspond to a characteristic lifetime rather than to a uniform age. [P1, P2, 19]
Dynamic-tension data are therefore meaningful only when the time variable is operationally defined. Reporting a value such as 'γ at 10 ms' without specifying how the 10 ms was determined can make comparisons between instruments misleading. [P1]
Initial adsorption during formation
A practical interface is rarely perfectly clean at the first measurable instant. Adsorption can occur during the mechanical formation of a drop or bubble. The resulting initial load Γ(0) depends on concentration, dosing rate, capillary geometry and the duration of formation. At high surfactant concentrations, a substantial adsorbed amount can exist at the interface before the instrument records its first tension value. [P1, P2, 19]
Initial-load effects provide one explanation for differences between short-time bubble-pressure data and longer-time profile-analysis data. The two methods create interfaces differently. A rigorous comparison must therefore consider whether the nominal t = 0 state is physically comparable. [P1]
Why method-to-method agreement is nontrivial
The lecture material explicitly compares data from bubble pressure and drop profile analysis and emphasizes that the methods complement one another rather than automatically overlap. Differences can arise from impurity adsorption, initial load, depletion and different definitions of interfacial age. A disagreement between methods is therefore not necessarily evidence that one instrument is wrong; it can reveal that the interfaces experienced different histories. [P2, P3, 7, 11, 18]
Time windows of dynamic tensiometry
The experimental methods discussed in Miller’s lectures cover overlapping but distinct time ranges. Maximum bubble pressure tensiometry is the principal method for the shortest surface ages, extending from below a millisecond into the second range and, depending on instrument design and protocol, toward tens of seconds. Drop-volume methods occupy an intermediate range from seconds to minutes. Drop and bubble profile analysis typically spans approximately one second to hours. Ring and plate methods are most suited to longer times. Note, these methods are still quite often used, in particular in industry laboratories, because respective norms for their use exist. [P2, P3, 7, 11, 18]
The exact limits should not be interpreted as universal constants. Viscosity, tension, capillary dimensions, density difference, image-acquisition speed, pneumatic volume and analysis algorithm all affect the usable range. The scientifically important point is that no single technique provides optimal data across every decade of time. [P1]
Method complementarity. The primary lecture material states explicitly that surface-tension methods complement one another over a broad interval of time: bubble pressure provides millisecond and sub-millisecond adsorption data, profile analysis is highly versatile, and capillary-pressure experiments are particularly valuable for liquid-liquid systems with small density differences. [P2, P3, 7, 11, 18]
Maximum bubble pressure tensiometry
Principle
Maximum bubble pressure tensiometry is one of the most important techniques for dynamic surface tension at short interfacial ages. Gas is driven through a capillary immersed in the liquid. A bubble grows at the capillary tip, and the pressure in the gas system changes as the bubble curvature evolves. The pressure reaches a characteristic maximum when the geometry at the capillary tip is approximately hemispherical. At this point, the capillary pressure contribution is related to surface tension through the Young-Laplace relation. [P2, P3, 7, 11, 18]
Δp = 2γ/R
If the radius of curvature at the pressure maximum is equal to the capillary radius r under the idealized geometry, the capillary pressure is approximately 2γ/r. Real instruments require more detailed correction because the measured pressure contains several contributions and the bubble-growth dynamics may deviate from the simplest spherical picture. [P2, P3, 16]
Pressure balance
The measured pressure is not only capillary pressure. The lecture material separates capillary, hydrostatic and hydrodynamic contributions. Hydrostatic pressure arises from the depth of the capillary tip below the free liquid surface. Hydrodynamic pressure reflects liquid and gas motion. The pneumatic response of tubing and the measuring volume can add further dynamic effects. [P2, P3, 7, 11, 18]
p_meas = p_capillary + p_hydrostatic + p_hydrodynamic + p_system
The exact correction scheme depends on instrument geometry and operating conditions. [P1]
This decomposition is not a minor calibration detail. At very short bubble times, hydrodynamic and pneumatic effects can become comparable to the capillary pressure difference being used to infer γ. A device can therefore display an apparent dynamic tension for pure water even though pure water has no adsorption process responsible for such a time dependence. The lectures explicitly use pure-water measurements to demonstrate this hydrodynamic artefact. [P2, P3, 7, 11, 18]
Bubble time, deadtime and lifetime
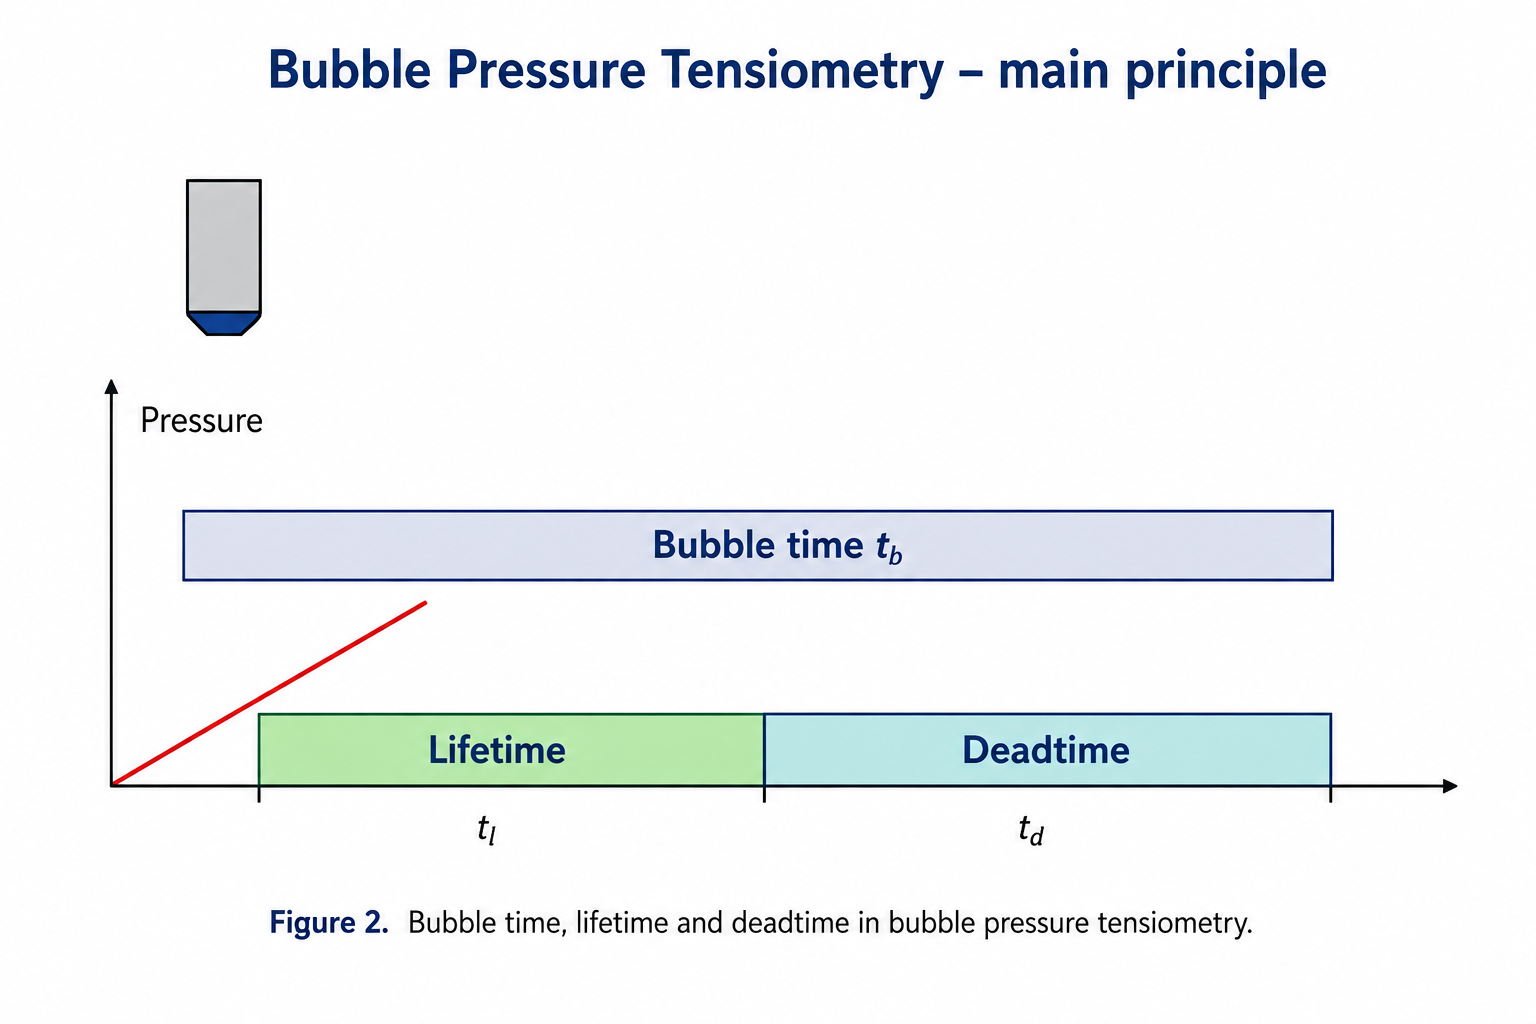
A defining feature of rigorous bubble-pressure analysis is the distinction between bubble time, deadtime and surface lifetime. The bubble time t_b is the total period between equivalent points of successive bubble cycles. It can be divided into the lifetime t_l of the relevant expanding interface and a deadtime t_d associated with the interval after the pressure maximum or detachment during which the next measurable interface is not yet in the same stage. [P2, P3, 7, 11, 18]
t_b = t_l + t_d
The surface lifetime relevant to the pressure maximum is therefore obtained from t_l = t_b - t_d, not by identifying the entire bubble period with surface age. Fainerman and Miller's treatment of maximum bubble pressure tensiometry places major emphasis on this distinction because short-time adsorption curves are highly sensitive to even small errors in age. [P2, P3, 7, 11, 18]
Viscosity dependence of deadtime
The lecture data show that deadtime depends strongly on liquid viscosity. This is physically reasonable because bubble detachment, capillary refill and hydrodynamic relaxation all slow down as viscosity increases. Data sets illustrated for viscosities spanning approximately 1 to more than 50 mPa s demonstrate that the deadtime cannot be treated as a universal instrument constant. [P2, P3, 7, 11, 18]
The consequence for dynamic surface tension is substantial. In the lecture example for C12DMPO solutions, different effective deadtimes lead to differences in measured dynamic tension on the order of 10 mN/m. At the shortest surface ages, this error is comparable to or larger than the kinetic effects one may be trying to resolve. [P2, P3, 7, 11, 18]
Measuring-system volume and pneumatic response
The apparent dynamic tension can also depend on the pneumatic volume of the measuring system. A larger gas reservoir changes the pressure-flow response and can distort the pressure maximum if the system is interpreted with an oversimplified static model. Pure-water experiments provide an effective diagnostic because any observed age-dependent tension is then attributable to measurement dynamics rather than surfactant adsorption. [P1, P2, 19]
Instrument design therefore matters. High-quality maximum bubble pressure measurements require fast pressure sensing, well-characterized gas flow, small and controlled pneumatic volume, precise capillary geometry and an analysis capable of separating hydrodynamic contributions from the desired capillary pressure. [P2, P3, 7, 11, 18]
Strengths
The principal strength of maximum bubble pressure tensiometry is access to the earliest adsorption regime. The Miller lectures identify it as the most frequently used dynamic surface-tension technique and emphasize its ability to reach below one millisecond. This time window is essential for distinguishing rapid adsorption mechanisms and for simulating fast processes such as spraying, printing and high-speed foam generation. [P2, P3, 7, 11, 18]
Limitations
The same speed that makes bubble-pressure tensiometry powerful also makes it experimentally demanding. Hydrodynamic corrections, surface-age definition, capillary wetting, viscosity, gas flow and pneumatic volume - all matter. Extrapolating short-time BPT data to equilibrium can also be unreliable because slow adsorption or relaxation processes may lie entirely outside the measured time window. The lecture material explicitly warns that such extrapolation can be quite inaccurate. [P1, P2, 19]
Drop and bubble profile analysis tensiometry
Principle
Profile analysis tensiometry determines surface or interfacial tension from the complete shape of an axisymmetric pendant or sessile drop or bubble. A video image is acquired, the interface contour is extracted, and the experimental coordinates are compared with the numerical solution of the Gauss-Young-Laplace equation. The best fit yields γ. [P2, P3, 4, 12, 13]
Δp(z) = Δp₀ + Δρgz = γ(1/R₁ + 1/R₂)
Gravity deforms a sufficiently large drop away from a sphere. The extent of this deformation depends on the density difference Δρ and on γ. By fitting the entire contour, profile analysis uses more geometric information than a single diameter or detachment force. Sub-pixel edge detection and accurate optical calibration are therefore central for a high precision. Since recently, there exists a DIN norm for the qualified used of drop/bubble profile tensiometers. [P2, P3, 4, 12, 13]
Dynamic measurements
Once a pendant drop or bubble has been created, its profile can be recorded continuously. This makes profile analysis particularly suitable for adsorption kinetics from approximately seconds to hours. The same interface can be followed as γ evolves, avoiding the need to create a new interface for every data point, like in bubble pressure or drop volume tensiometry. [P2, P3, 4, 12, 13]
For liquid-liquid systems, profile analysis is especially attractive because the interface can remain immersed and undisturbed while the adsorption process proceeds. Surfactant can be present in the drop, in the surrounding phase or in both. The interpretation must then consider partitioning and possible transfer between phases. [P2, P3, 4, 12, 13]
Depletion in finite drops
The major dynamic complication of a pendant solution drop is depletion. Adsorption removes surfactant from the finite drop volume. When the total amount available in the drop is comparable to the adsorbed amount, the bulk concentration decreases during the experiment. The mass balance is [P2, P3, 4, 12, 13]
c₀V = cV + ΓA
Here c_0 is the initial concentration, c the concentration after adsorption, V the drop volume and A the interfacial area. Kairaliyeva, Aksenenko, Mucic, Makievski, Fainerman and Miller showed that depletion can be significant for a range of surfactants and that it must be accounted for in quantitative analysis of dynamic tension and adsorption. [P2, P3, 8, 19]
The corresponding effect is typically much smaller for a bubble immersed in a large liquid reservoir because the accessible bulk volume is much larger relative to the bubble area. This explains why drop and bubble measurements can yield different apparent adsorption behavior even for the same nominal solution. [P1, P2, 19]
Initial load and drop formation
Profile-analysis experiments also have an initial-load problem. During dosing of the drop, adsorption can begin immediately. The first image acquired after the target drop volume is reached therefore does not necessarily correspond to Γ = 0. The effect is strongest for rapidly adsorbing surfactants and high concentrations. In order to properly consider the initial load Γ(0) the Ward & Tordai equation has to be modified respectively: [P2, P3, 8, 19]
Γ(t) = Γ(0) + 2c₀√(Dt/π) − 2√(D/π) ∫₀ᵗ c_s(τ)/√(t−τ) dτ
A mechanistic model can include Γ(0) as an initial condition. Alternatively, the formation protocol can be made reproducible and the earliest data interpreted as the state after a defined preparation interval rather than as a perfectly clean surface. [P1]
Combining bubble pressure and profile analysis
A central theme in Miller’s lectures is that bubble pressure and profile analysis complement one another. Bubble pressure resolves the earliest adsorption stages; profile analysis extends the same system to longer times. When both techniques are applied to the same surfactant concentration series, a dynamic curve can be constructed across several orders of magnitude in interfacial age. [P2, P3, 7, 11, 18]
The lectures illustrate this directly for decyl dimethyl phosphine oxide, where bubble-pressure and drop-profile data are compared with theoretical adsorption curves. The scientific value lies not merely in increasing the number of data points. Agreement across methods tests whether a single kinetic and thermodynamic model can describe both short- and long-time adsorption. [P1, P2, 1, 19]
Disagreement is equally informative. If short-time data lie systematically above or below the continuation of the profile-analysis curve, possible explanations include impurity adsorption, differences in initial load, finite-drop depletion, hydrodynamic corrections or inconsistent definitions of interfacial age. Method comparison therefore becomes a diagnostic tool for experimental validity. [P1, P2, 19]
Drop pressure and capillary pressure techniques
Motivation
Pendant-drop profile analysis relies on gravitational deformation. If the density difference between two liquid phases is extremely small, a drop remains nearly spherical and its profile contains little information about γ. The lecture material gives the example of a dichlorodecane-water system with a density difference on the order of 0.001 g cm^-3, for which spherical-drop methods based on pressure become especially useful. [P2, P3, 4, 12, 13]
Capillary pressure
For a spherical or nearly spherical interface with known radius R, the Young-Laplace equation provides the tension directly from the pressure difference. A pressure sensor can therefore replace gravitational deformation as the primary observable. [P1]
γ = ΔpR/2
Capillary-pressure methods are valuable for dynamic liquid-liquid measurements and can extend to relatively short times. They also provide the basis for high-frequency oscillating-drop experiments, where rapid changes in capillary pressure track the tension response while the interface is periodically expanded and compressed. [P2, P3, 16, 5, 14]
Connection to interfacial rheology
Dynamic tension and interfacial rheology are closely related but should not be seen as identical. In a simple adsorption experiment, γ changes because the interface evolves toward equilibrium. In a rheological experiment, the interface is deliberately perturbed and the phase relation between area and tension is analyzed. Capillary-pressure techniques enable oscillations into the high-frequency regime and therefore connect dynamic tensiometry to the frequency-dependent mechanical response of adsorption layers. [P4, P1, 5, 14, 15]
Drop-volume tensiometry
Drop-volume tensiometry is a classical method in which the volume or weight of a drop at detachment from a capillary is related to the balance between gravitational and capillary forces. It can be used at liquid-gas and liquid-liquid interfaces and occupies an intermediate dynamic time range between very rapid bubble-pressure measurements and long-time static techniques. [P1]
Its apparent simplicity hides an important dynamic limitation. The lecture material, following the treatment by Javadi, Fainerman and Miller in Bubble and Drop Interfaces, emphasizes that liquid inflow can continue during detachment. The detached volume therefore depends on flow rate and necking dynamics. If this hydrodynamic contribution is ignored, the method can produce an apparent surface tension that is not the actual interfacial tension at the assigned age. For pure water, at short time a dynamic surface tension would for example be observed, which physically nonsense. [P1]
Drop-volume data should therefore be interpreted only within a validated range of flow rates and with an appropriate detachment model. The method remains useful, particularly where its time window matches the adsorption process, but it does not provide a universally correction-free bridge between bubble pressure and profile analysis. [P2, P3, 7, 11, 18]
Experimental artefacts and sources of disagreement
Surface-active impurities
Trace contamination is one of the most important sources of error in dynamic surface-tension measurements. An impurity can be present at a concentration too low to influence bulk analysis yet becomes strongly enhanced at the interface. Because impurity adsorption is often slower than adsorption of the principal surfactant, the apparent dynamic tension can show a long-time decrease that is incorrectly attributed to intrinsic kinetics. [P1, P2, 19]
The lecture about the comparison of BPA and PAT explicitly identifies impurity effects as a cause of differences between short- and long-time data. At concentrations above the CMC, hydrophobic impurities can become solubilized in micelles, changing their effective monomer concentration and therefore their adsorption behavior. This can produce non-intuitive concentration dependence. [P1, P2, 19]
Hydrodynamic artefacts
Hydrodynamic effects are most critical in rapid pressure-based methods. A pure-water system should not display adsorption-driven dynamic surface tension, yet an apparent time dependence can be observed when the pressure response of the measuring system is not correctly separated from capillary pressure. Such reference measurements are therefore a powerful validation of the proper functioning of the instrument and analysis. [P2, P3, 16, 19]
Wrong surface-age assignment
An incorrect surface age distorts the horizontal axis of γ(t), which can then alter the inferred diffusion coefficient or kinetic barrier even if the measured tension itself is accurate. In bubble-pressure tensiometry, using bubble time rather than effective lifetime is a classic example. The error becomes proportionally largest at the shortest times. [P1, P2, 2, 19, 7]
Temperature
Surface tension, diffusion coefficients, viscosity, adsorption equilibria and micellar kinetics are temperature dependent. Temperature control is therefore not merely a requirement for comparing equilibrium tensions. It changes the entire dynamic process. Measurements intended for kinetic modeling should report the actual sample temperature and the method of thermal control. [P1, P2, 2, 19]
Viscosity
Viscosity affects bulk transport and the hydrodynamics of the measurement system. In BPT it changes deadtime and pressure losses. In drop formation it changes dosing and detachment dynamics. A correction procedure validated for water-like solutions should not automatically be applied to highly viscous formulations. [P2, P3, 7, 11, 18]
Density difference
Density difference is central to profile analysis. If Δρ is inaccurate, the fitted γ is systematically biased. If Δρ is too small, the drop becomes nearly spherical and the inversion becomes poorly conditioned. In such systems, capillary-pressure techniques may be more appropriate. [P2, P3, 4, 12, 13]
Evaporation and composition drift
Volatile solvents and small drops are susceptible to evaporation. A changing drop volume alters area, concentration and possibly temperature. In liquid-liquid systems, mutual solubility can produce composition drift even without evaporation. Pre-saturation, closed cells and control experiments are often necessary for long dynamic measurements. [P2, P3, 8]
Dynamic interfacial tension at liquid-liquid interfaces
Liquid-liquid interfaces introduce additional transport pathways. A surfactant can be soluble in one phase, in both phases or initially present on opposite sides in a multicomponent system. Adsorption is then coupled to partitioning and interphase transfer. The concentration adjacent to the interface is no longer determined by a single semi-infinite reservoir. [P1, P2, 19]
The experimental method must also account for density difference. Profile analysis is highly versatile when Δρ is sufficiently large to deform the drop. Capillary-pressure methods become particularly valuable when the densities are nearly matched. The lecture material explicitly identifies capillary-pressure experiments as unique for liquid-liquid systems with small density difference, and are the ultimate method for interfacial studied und microgravity conditions. [P2, P3, 4, 12, 13]
The most complex cases involve more than one surface-active component distributed between both phases. The PAT/BPT lecture considers a system with two surfactants, one initially dissolved in water and the other in oil, both partially soluble in both phases. Correct interpretation then requires distribution coefficients, transfer rates, depletion in the finite drop and sufficiently rapid oscillations if interfacial rheology is to be measured before bulk redistribution dominates. [P4, P1, 5, 14, 15]
Dynamic tension and interfacial rheology
Dynamic surface tension and interfacial viscoelasticity share a common molecular origin: both depend on the ability of an adsorption layer to respond to changes in area and composition. However, they answer on different questions. Dynamic tension follows spontaneous relaxation after interface creation. Interfacial rheology measures the response to a controlled small deformation, typically generated close to the adsorption equilibrium state. [P4, P1, 5, 14, 15]
In oscillating-drop experiments, the interface is expanded and compressed sinusoidally. The resulting tension change can have an elastic component in phase with area and a viscous component shifted in phase. The complex dilational modulus is commonly written as [P4, 5, 14, 15]
E* = dγ / d ln A = E′ + iE″
The frequency dependence of E* reflects the competition between deformation and adsorption relaxation. At low frequency, surfactant can exchange with the bulk during each cycle and partially restore equilibrium. At high frequency, the interfacial composition is effectively trapped over a cycle, producing a larger elastic response. Fast capillary-pressure oscillations extend this analysis toward tens or hundreds of hertz. [P4, P1, 5, 14, 15]
For the present review, rheology is important mainly because it illustrates a broader principle: the observed interfacial property always depends on the relation between the experimental timescale and the molecular relaxation times. This principle is the unifying concept behind dynamic tension, adsorption kinetics and interfacial viscoelasticity. [P4, P1, 5, 14, 15]
Interpreting dynamic surface-tension curves
Early-time plateau or induction period
A dynamic curve may begin near the solvent tension and remain nearly constant for a finite time. This can indicate that insufficient surfactant has reached the interface to produce a measurable surface-pressure change. It can also arise from instrumental deadtime or limited time resolution. Distinguishing molecular induction from measurement limitation requires a validated short-time technique. Inductions times as an initial period during which the tension is not decreased are observed for proteins and its length depends on the protein bulk concentration. [P2, P3, 7, 11, 18]
Rapid decay
A steep early decrease in γ is consistent with rapid molecular delivery and a strong equation-of-state response at low coverage. Increasing surfactant concentration generally shifts this decrease to shorter times. In ionic systems, electrolyte can have a similar effect by reducing electrostatic barriers. In addition, due to the salting out effect, ionic surfactants are more surface active in higher electrolyte concentrations. [P1, P2, 19]
Multiple relaxation regimes
Two or more slopes on a logarithmic time axis can indicate multiple processes: fast diffusion followed by slow reorientation, sequential adsorption of different components, micellar relaxation, impurity adsorption or transition from diffusion control to interfacial kinetic control. The curve alone does not identify the mechanism uniquely. [P1, P2, 2, 19]
Non-monotonic behavior
Growing or deforming interfaces can produce non-monotonic dynamic tension because area creation and adsorption compete. Mixed systems can also display overshoots or transient plateaus when a fast species adsorbs first and is later displaced. Such behavior should not automatically be smoothed away as experimental noise. [P1, P2, 19]
Equilibrium extrapolation
Extrapolating short-time measurements to infinite time is attractive when equilibrium experiments are inconvenient, but it is fundamentally model dependent. The lecture material explicitly notes that extrapolation of BPT data to equilibrium can be inaccurate. If slow processes are outside the measured window, no mathematical extrapolation can recover them reliably without additional physical assumptions. [P1]
Applications
Foaming
Foam formation creates new air-liquid area rapidly. The relevant tension during bubble formation can be much closer to the solvent value than to the equilibrium surfactant value if adsorption is slow. Dynamic surface tension therefore influences bubble size, energy input and the early stabilization of newly formed foam films. [P1, P2, 19]
Foam stability after formation depends additionally on interfacial rheology, Marangoni stresses, drainage and thin-film forces. Dynamic tension is consequently a necessary but not sufficient descriptor of foam performance. [P4, 5, 14, 15]
Emulsification
During homogenization or high-shear emulsification, oil-water area is generated on short timescales. Surfactants must reach the new interface before droplets collide and coalesce. Dynamic interfacial tension is therefore more directly related to droplet formation and early stabilization than equilibrium tension measured after the emulsion has aged. [P1, P2, 19]
Coatings and printing
In coating, spraying and inkjet printing, the interface may exist for milliseconds before contacting a substrate. A formulation can exhibit excellent equilibrium wetting yet fail dynamically if the surface tension remains too high during droplet formation and impact. Bubble-pressure tensiometry is particularly relevant where the process timescale lies in the millisecond range. [P1]
Detergency and cleaning
Detergency involves rapid creation of liquid-air, liquid-solid and liquid-oil interfaces. Adsorption kinetics influence wetting, penetration and soil removal. The equilibrium surface tension of a detergent solution is therefore only part of its performance profile. [P1, P2, 19]
Pharmaceuticals and biopharmaceuticals
Protein solutions and surfactant-containing formulations can experience repeated creation of interfaces during pumping, filling, shaking or aerosolization. Proteins often adsorb and rearrange more slowly than small surfactants, while surfactants can compete with proteins for the same interface. Dynamic interfacial measurements help distinguish these kinetic processes. [P1, P2, 19]
Food systems
Whipping, aeration and emulsification in foods create interfaces on processing timescales. Proteins, phospholipids and low-molecular-weight surfactants can compete dynamically. The composition of a freshly formed interface may differ strongly from the equilibrium layer that develops during storage. [P1, P2, 19]
Method selection
The experimental method should be selected from the timescale and geometry of the scientific problem rather than from instrument availability alone. For sub-millisecond to millisecond surface ages, maximum bubble pressure is the primary technique. For seconds to hours and for detailed liquid-liquid studies, profile analysis is generally the most versatile method. Drop-volume methods can provide intermediate-time information but require careful hydrodynamic interpretation. Capillary-pressure techniques are particularly valuable for small density differences and fast liquid-liquid measurements. [P2, P3, 7, 11, 18]
A complete adsorption study often uses more than one technique. The objective is to construct overlapping time windows and test whether the same kinetic model describes all data. Overlap is scientifically valuable because it reveals systematic offsets due to age definitions, impurities, depletion or instrumental corrections. [P1, P2, 19]
Recommended strategy. Use the fastest method only where its pressure and age corrections remain physically valid; use profile analysis for the long-time continuation; and verify overlap rather than extrapolating one technique far beyond its natural window. [P2, P3, 4, 12, 13]
Recommended reporting standard
A dynamic surface or interfacial tension value is reproducible only if the experimental history is reported. At minimum, the report should identify the complete sample composition, concentration basis, temperature, density and viscosity where relevant; the tensiometric method and geometry; capillary dimensions or drop volume; the definition of interfacial age; the interface-formation protocol; and all corrections applied to the raw observable. [P2, P3, 8, 19]
For bubble-pressure measurements, bubble time, deadtime and the method used to derive lifetime should be documented. The capillary radius, immersion depth, pneumatic volume and hydrodynamic correction are important at short times. For profile analysis, optical calibration, density difference, drop or bubble volume and the treatment of finite-volume depletion should be stated. [P2, P3, 7, 11, 18]
Dynamic measurements should include replicate behavior rather than only smoothed mean curves. Reference measurements with pure liquids are valuable for identifying hydrodynamic or contamination effects. If kinetic parameters are fitted, the thermodynamic equation of state and adsorption model used in the fit should be reported explicitly. [P1, P2, 1, 19]
Conclusions
Dynamic surface and interfacial tension are time-resolved thermodynamic observables of evolving fluid interfaces. They arise because adsorption and molecular relaxation require finite time after an interface has been created. The measured function γ(t) therefore reflects both the transport of molecules to the interface and the free-energy relation between interfacial composition and tension. [P1, P2, 1, 19]
Diffusion represents the classical starting point. The Ward-Tordai theory describes adsorption to a newly generated interface while accounting for depletion of the subsurface region and back-diffusion. At short times, Γ commonly scales with the square root of time. Real systems may depart from this ideal through electrostatic or kinetic adsorption barriers, convection, micellar relaxation, interfacial reorientation, multicomponent competition or finite-volume depletion. [P1, P2, 2, 19, 17]
The experimental definition of time is as important as the tension measurement itself. Maximum bubble pressure tensiometry reaches the shortest surface ages but requires a rigorous distinction between bubble time, deadtime and lifetime, together with correction for hydrostatic, hydrodynamic and pneumatic effects. Profile analysis tensiometry extends the observation window to seconds, minutes and hours and is highly versatile for liquid-liquid interfaces, but finite-drop depletion and initial load must be considered. Drop-volume and capillary-pressure techniques provide complementary information in intermediate and specialized regimes. [P2, P3, 7, 11, 18]
The strongest interpretation is obtained when methods are combined rather than extrapolated beyond their natural limits. Bubble-pressure and drop-profile data can jointly span several decades of interfacial age and test a common adsorption model. Apparent disagreement can reveal impurities, hydrodynamic artefacts, age-definition errors or geometry-dependent depletion. In this sense, method comparison is part of the scientific analysis rather than merely a validation exercise. [P1, P2, 19]
Dynamic tension should therefore never be reported as a single number without context. It is the tension of a specific interface at a specific age under a specific formation and deformation history. When this principle is respected, dynamic tensiometry becomes a quantitative bridge between molecular adsorption kinetics and the practical behavior of foams, emulsions, coatings, sprays, biological formulations and other systems in which interfaces are created faster than they can equilibrate. [P1, P2, 19]
Audited scientific source basis
Primary lecture sources
P1. Dynamic surface and interfacial tension methods, by SINTERFACE Technologies.
P2. Profile Analysis Tensiometry (PAT) and Maximum Bubble Pressure (BPT): Fundamentals and Applications, by SINTERFACE Technologies.
P3. Surface and Interfacial Tension Measurements, by SINTERFACE Technologies.
P4. Experimental methods to measure the adsorption at liquid interfaces, by SINTERFACE Technologies.
P5. Dilational and Shear Rheology of Interfacial Layers, by SINTERFACE Technologies.
Published literature cited in this review
J. W. Gibbs, The Collected Works of J. Willard Gibbs, Vol. 1: Thermodynamics, Longmans, Green and Co., 1928.
A. F. H. Ward and L. Tordai, Time-dependence of boundary tensions of solutions. I. The role of diffusion in time-effects, Journal of Chemical Physics 14 (1946) 453-461. DOI: 10.1063/1.1724167.
A. I. Rusanov and V. A. Prokhorov, Interfacial Tensiometry, Studies in Interface Science, Vol. 3, Elsevier, Amsterdam, 1996.
D. Möbius and R. Miller (Eds.), Drops and Bubbles in Interfacial Research, Studies in Interface Science, Vol. 6, Elsevier, Amsterdam, 1998.
R. Miller and L. Liggieri (Eds.), Interfacial Rheology, Progress in Colloid and Interface Science, Vol. 1, 2009.
R. Miller and L. Liggieri (Eds.), Bubble and Drop Interfaces, Progress in Colloid and Interface Science, Vol. 2, Brill, Leiden/Boston, 2011.
V. B. Fainerman and R. Miller, Maximum Bubble Pressure Tensiometry: Theory, Analysis of Experimental Constraints and Applications, in: R. Miller and L. Liggieri (Eds.), Bubble and Drop Interfaces, 2011, pp. 75-118. DOI: 10.1163/ej.9789004174955.i-558.38.
A. Javadi, V. B. Fainerman and R. Miller, Drop Volume Tensiometry, in: R. Miller and L. Liggieri (Eds.), Bubble and Drop Interfaces, 2011, pp. 119-141.
C. A. MacLeod and C. J. Radke, A Growing Drop Technique for Measuring Dynamic Interfacial Tension, Journal of Colloid and Interface Science 160 (1993) 435-448. DOI: 10.1006/jcis.1993.1415.
C. A. MacLeod and C. J. Radke, Measurement of Dynamic Surface Tension by a Growing Drop Technique, Journal of Colloid and Interface Science 168 (1994) 47-60. DOI: 10.1006/jcis.1994.1392.
J. Meissner, J. Krägel, C. Frese, S. Rupert, V. B. Fainerman, A. V. Makievski and R. Miller, Comparative studies of the dynamic surface pressure of C12EO6 solutions performed using different maximum bubble pressure tensiometers, SÖFW-Journal 130 (2004) 41-46.
T. Kairaliyeva, E. V. Aksenenko, N. Mucic, A. V. Makievski, V. B. Fainerman and R. Miller, Surface Tension and Adsorption Studies by Drop Profile Analysis Tensiometry, Journal of Surfactants and Detergents 20 (2017) 1225-1241. DOI: 10.1007/s11743-017-2016-y.
M. Ferrari, L. Liggieri, F. Ravera, C. Amodio and R. Miller, Adsorption kinetics of alkyl phosphine oxides at the water/hexane interface. 1. Pendant drop experiments, Journal of Colloid and Interface Science 186 (1997) 40-45.
J. Lucassen and M. van den Tempel, Dynamic measurements of dilational properties of a liquid interface, Chemical Engineering Science 27 (1972) 1283-1291.
J. Lucassen and M. van den Tempel, Longitudinal waves on visco-elastic surfaces, Journal of Colloid and Interface Science 41 (1972) 491-498.
A. Passerone, L. Liggieri, N. Rando, F. Ravera and E. Ricci, Capillary pressure methods for fast interfacial dynamics, Journal of Colloid and Interface Science 146 (1991) 152.
A. Javadi, J. K. Ferri, T. D. Karapantsios and R. Miller, Interface and bulk exchange: single drop experiments and CFD simulations, Colloids and Surfaces A 365 (2010) 145.
V. B. Fainerman and R. Miller, Maximum bubble pressure tensiometry - an analysis of experimental constraints, Advances in Colloid and Interface Science 108-109 (2004) 287-301. DOI: 10.1016/j.cis.2003.10.010.
V. B. Fainerman, D. Möbius and R. Miller (Eds.), Surfactants: Chemistry, Interfacial Properties, Applications, Studies in Interface Science, Vol. 13, Elsevier, Amsterdam, 2001.
Continue exploring adsorption kinetics and time-resolved interfacial measurements.