Glossary

Ring Tensiometry after du Noüy

The ring tensiometry is the most frequently used technique to measure the surface tension of pure liquids and solutions. As mentioned above the ring tensiometry is difficult to apply to liquid/liquid interfaces, as it is connected with complicated wetting problems. The same is true for the plate tensiometry, so that complementary techniques are required for these interfaces.

Theoretical basis

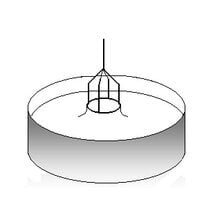
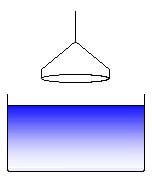
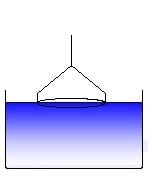
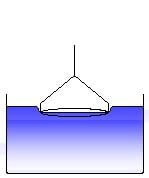
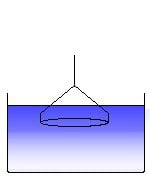
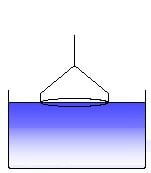
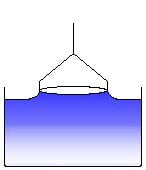
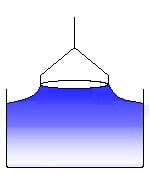
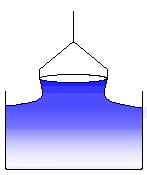
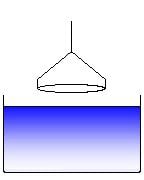
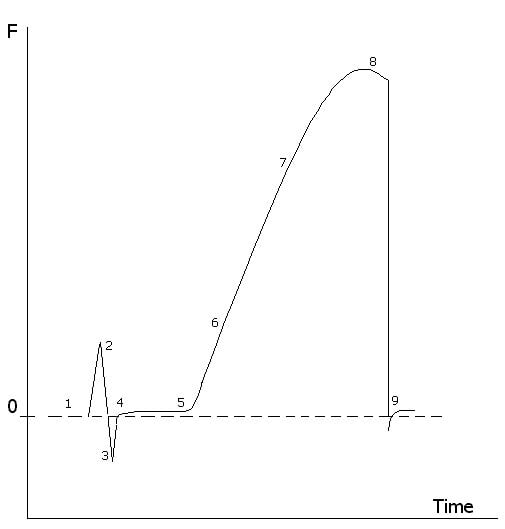
In the du Noüy ring method, a thin wire ring is inserted below the interface (which can be either a liquid-vapour or liquid-liquid interface) and held horizontal. Then the ring is pulled up through the interface. The force F measured by a balance goes through a maximum Fmax [[i]]. In a first approximation the surface tension g is given by
[i]. L. du Noüy, J. General Physiol. 1(1919)521

Formula

where R is the radius of the ring. Note that for Eq. (V.1) to hold, the radius of the wire must be much smaller than the radius of the ring and that the solution must wet the wire completely. For this reason a clean platinum wire is usually used.
For precise measurements, the use of a correction factor f to the ideal case is required


Formula

This correction factor fcorr is a function of the ring geometry and the liquid density r and is included into the software of most tensiometers, such as the TE 2/3. However, it can be also determined by using the tables. For example Harkins and Jordan [[i]] have tabulated the factor as a function of R/r and R3/V, where r is the radius of the wire and V=Fmax/(g Dr) is the volume of the liquid raised above the free surface. Further authors have improved the accuracy of the corrections factors and extended the table also to a wider range of R/r ratios [[ii]]. The table of correction factors given in the Appendix I is taken from [5].
[i]. W.D. Harkins and H.F. Jordan, J. Am. Chem. Soc., 52 (1930) 1751 [ii]. C. Huh C and S.G. Mason, Colloid Polymer Sci., 253(1975)566, 255(1977)460

Experimental procedure

The ring tensiometry is based on pulling a ring out of a liquid and measuring the weight of the attached liquid meniscus.

Scientific Setup

Figure 1: Experimental setup for profile analysis tensiometry.

Principle of the ring tensiometry.
The stages of a du Noüy ring experiment for measuring the surface
Scientific Setup

Figure 1: Experimental setup for profile analysis tensiometry.

The ring is outside the liquid and is moved in direction to the surface (or equivalently the liquid container is moved upwards towards the ring). This position is used to determine the zero point of the electronic force balance. (1)
Scientific Setup

Figure 1: Experimental setup for profile analysis tensiometry.

The ring touches the liquid surface. The measured force decreases slightly due to buoyancy of the ring. (2)  
Scientific Setup

Figure 1: Experimental setup for profile analysis tensiometry.

The ring has to be wetted by the liquid. A certain force can be necessary to immerse the ring into the liquid, equivalent to the work of wetting. (3)
Scientific Setup

Figure 1: Experimental setup for profile analysis tensiometry.

The ring is immersed into the liquid. This is the starting position of a surface tension experiment. (4)  
Scientific Setup

Figure 1: Experimental setup for profile analysis tensiometry.

The ring is moved out of the liquid with a constant speed. (5)  
Scientific Setup

Figure 1: Experimental setup for profile analysis tensiometry.

A liquid meniscus is pulled out by the ring. The measured force increases. (6)
Scientific Setup

Figure 1: Experimental setup for profile analysis tensiometry.

The liquid meniscus increases and the force approaches a maximum. (7)
Scientific Setup

Figure 1: Experimental setup for profile analysis tensiometry.

The force passes the maximum and decreases again. The maximum force corresponds to the surface tension of the measured liquid, according to the equation (V.2) given above. (8)
Scientific Setup

Figure 1: Experimental setup for profile analysis tensiometry.

Further pulling the ring leads to a rupture of the meniscus. This process is to be avoided and the software cares about that the ring, after the maximum force has been passed, is moved back into the liquid again. (9)          
Scientific Setup

Figure 1: Experimental setup for profile analysis tensiometry.

Fig. V.2 Schematic change of the force measured during the process of a ring tensiometer experiment After the position (4) is re-established, a subsequent measurement can be started. The force measured by the force transducer of the tensiometer changes in the way shown schematically in Fig. V.2. The given numbers refer to the various stages of the experiment. The software controls the ring movement (actually it is the dish containing the liquid that is moved while the ring is in rest) and determines the maximum weight of the formed meniscus.

Effect of contact angle

In contrast to the plate technique discussed below, the effect of the contact angle on the force measurements is of minor importance [[i]]. However, in general a zero contact angle is assumed and the correction factors calculated refer to this value. In particular for thicker wires the effect of contact angle can become remarkable. In some cases, when the contact angle becomes very large, as it may be the case in measurements of cationic surfactant solutions, a measurement is impossible as no meniscus is formed at the ring. In these cases typically the Wilhelmy plate technique fails due to the same reasons and other techniques must be applied, such as the drop shape method [[ii], [iii]].

Effect of adsorption layer expansion

The ring method is similar to the plate method, however it is not truly a static method, as the force measurement is performed while the ring is moving, thus the interfacial area is increasing throughout the measuring process. By performing the process in a slow enough fashion, a good approximation to the equilibrium surface tension can be obtained. However, this is often difficult to achieve, particularly for dilute solutions of highly surface-active material that may require a relatively large time to reach equilibrium. A quantitative analysis has been performed by Lunkenheimer and Wantke [[iv], [v]]. It was impressively shown, that the effect of the surface layer expansion is far larger than the accuracy of the ring tensiometry and can amount to several mN/m. Hence, studies of surfactant solutions, in particular of highly surface active compounds, require special care. Mainly, small dishes for the studied solutions are unsuitable and must be replaced by those of sufficiently large diameter.


[i]. K. Lunkenheimer, J. Colloid Interface Sci., 131(1989)580
[ii]. P. Chen, D.Y. Kwok, R.M. Prokop, O.I. del Rio, S.S. Susnar and A.W. Neumann, in Drops and Bubbles in Interfacial Research, in “Studies of Interface Science”, Vol. 6, D. Möbius and R. Miller (Eds.), Elsevier, Amsterdam, 1998, pp. 61
[iii]. G. Loglio, P. Pandolfini, R. Miller, A.V. Makievski, F. Ravera, M. Ferrari
and L. Liggieri, Drop and Bubble Shape Analysis as Tool for Dilational Rheology Studies of Interfacial Layers, in “Novel Methods to Study Interfacial Layers”, Studies in Interface Science, Vol. 11, D. Möbius and R. Miller (Eds.), Elsevier, Amsterdam, 2001, p. 439-484
[iv]. K. Lunkenheimer and K.D. Wantke, Colloid Polymer Sci., 259(1981)354 [v]. K. Lunkenheimer, Tenside Detergents, 19(1982)272
Back to Science Glossary